Dan Ness, Principal Analyst, MetaFacts, November 5, 2020
Some information such as news, sports, and weather are most useful when they’re current and easily available. There are many ways to get this information across smartphones, PCs, or tablets. Some users are more actively intent on tapping into this information, and different age groups prefer different devices. This MetaFAQs reports on the active use of checking the news, sports, and weather information by smartphone, PC, tablet, or across all three. Further, it reports on activity levels by age group and country.
About MetaFAQs
MetaFAQs are answers to frequently asked questions about technology users. The research results showcase the TUP/Technology User Profile study, MetaFacts’ survey of a representative sample of online adults profiling the full market’s use of technology products and services. The current wave of TUP is TUP/Technology User Profile 2020, which is TUP’s 38th annual.
Current subscribers may use the comprehensive TUP datasets to obtain even more results or tailor these results to fit their chosen segments, services, or products. As subscribers choose, they may use the TUP inquiry service, online interactive tools, or analysis previously published by MetaFacts.
On request, interested research professionals can receive complimentary updates through our periodic newsletter. These include MetaFAQs – brief answers to frequently asked questions about technology users – or TUPdates – analysis of current and essential technology industry topics. To subscribe, contact MetaFacts.
Usage guidelines: This document may be freely shared within and outside your organization in its entirety and unaltered. It may not be used in a generative AI system without express written permission and licensing. To share or quote excerpts, please contact MetaFacts.
Dan Ness, Principal Analyst, MetaFacts, October 13, 2020
Apple iPhones appeal more strongly to some age groups than others, just as certain wireless carriers have attracted more of some age groups than others. This MetaFAQs looks at the age distribution of American Apple iPhone users by their wireless carrier.
Usage guidelines: This document may be freely shared within and outside your organization in its entirety and unaltered. It may not be used in a generative AI system without express written permission and licensing. To share or quote excerpts, please contact MetaFacts.
Dan Ness, Principal Analyst, MetaFacts, October 7, 2020
Users of the hyper-local social network Nextdoor have developed a reputation distinct from Facebook or Instagram users. This MetaFAQs details the generational age distribution of American adults that sometimes use Nextdoor, only use Nextdoor instead of other major social networks, as well as those who actively use Facebook, Instagram, or any major social network.
Usage guidelines: This document may be freely shared within and outside your organization in its entirety and unaltered. It may not be used in a generative AI system without express written permission and licensing. To share or quote excerpts, please contact MetaFacts.
Dan Ness, Principal Analyst, MetaFacts, December 19, 2019
Smartwatch and fitness band penetration tapers to 2016 levels
The race for the wrist has settled into a larger-than-niche and less-than-majority position. Over the last three years, the share of online Americans using at least one smartwatch has grown from one in six to one in five, only to settle back to the one in six level. This is based on TUP/Technology User Profile 2019 survey of 8,060 online adults in the US, and from the prior three annual waves.
Usage guidelines: This document may be freely shared within and outside your organization in its entirety and unaltered. It may not be used in a generative AI system without express written permission and licensing. To share or quote excerpts, please contact MetaFacts.
Playing games is a regular activity for most adults whether using game consoles or gaming PCs, or any of their connected devices – mobile phones, tablets, or PCs.
Convenience Gamers – those using only a connected device to play games – have near-equal market penetration to Dedicated Gamers – users of game consoles or gaming PCs.
Device-Gamers – who use any of their connected devices – is a larger segment than either Dedicated Gamers or Convenience Gamers.
This TUPdate looks at the major trends of game-playing in the US and other countries, focusing on Convenience Gamers – the next tier of game-players beyond Dedicated Gamers. Also, it examines which types of devices are used the most or least for playing games. Further, it investigates whether younger adults play more or less than older ones, and differences in digital media use and subscriptions.
About TUPdates
The analysis in this TUPdate is based on results drawn from the 2019 wave of TUP (Technology User Profile), which is TUP’s 37th continuous wave. Results from previous waves are also included where indicated. This survey-based study details the use of technology products by a carefully-selected and weighted set of respondents drawn to represent online adults.
On request, interested research professionals can receive complimentary updates through our periodic newsletter. These include MetaFAQs – brief answers to frequently asked questions – or TUPdates – analysis of current topics in the technology industry. To learn about subscribing to the TUP/Technology User Profile service, contact MetaFacts.
Usage guidelines: This document may be freely shared within and outside your organization in its entirety and unaltered. It may not be used in a generative AI system without express written permission and licensing. To share or quote excerpts, please contact MetaFacts.
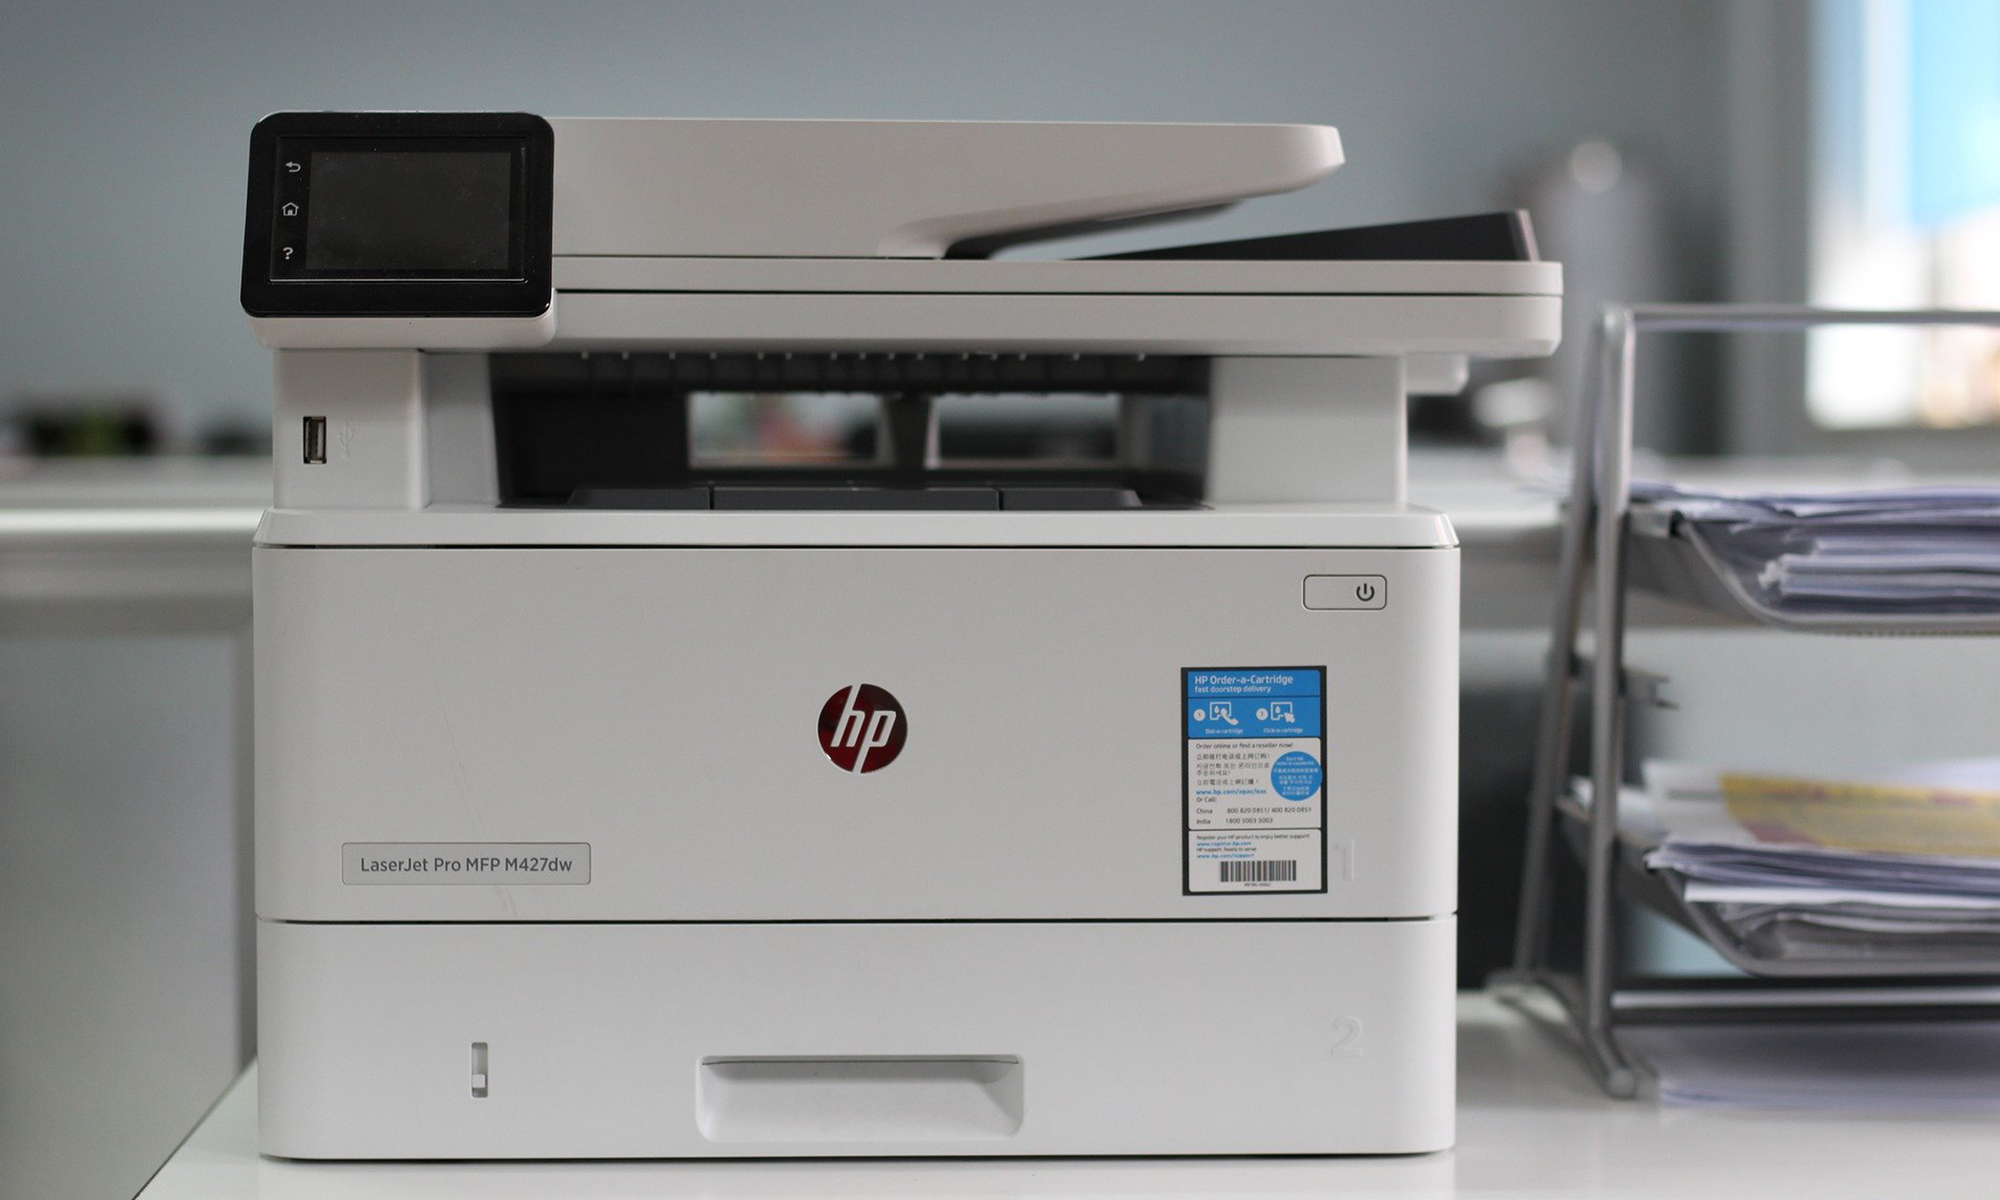
Dan Ness, Principal Analyst, MetaFacts, November 7, 2019
Overview
Printing at home has changed in recent years. Printer manufacturers continue to innovate in order to compete and encourage broad active printer use.
This TUPdate looks at the major trends in home printing in the US, and examines how users have changed in both what they print and their volume of printing. Also, it examines printing trends with respect to the broadened use of mobile devices. Further, it looks into whether younger adults print more or less than older ones, and whether presence of children makes a difference.
The source for this analysis is MetaFacts TUP/Technology User Profile, with results from waves 2015 through 2019, all based on surveys of from 7,326 to 8,060 online adults in the US.
Home printer penetration
The majority of online adults in the US use a home printer, although market penetration has dropped over the last two years.
In 2019, 68% of online adults in the US actively use a home printer. This is effectively the same level as in 2018 – 67%. However, this share had been a stable 73% between 2015 to 2017.
The decline has been driven by substitutes, primarily increased use mobile devices
Home printer page volume has declined
While the penetration of home printers has dropped slowly then stabilized, the number of pages being printed has dropped faster.
The average number of pages printed per month has dropped from 38.6 per month in 2015 to 31.8 in 2019, a reduction of nearly 20%.
Mobile substitutes for printing
One of the biggest contributors to the decline in printing – the mass move to mobile platforms. Americans are increasingly using their smartphones to find their way instead of printing maps or directions. That change is happening surely yet slowly.
It may surprise many digital natives that as many as 43.7 million Americans still occasionally print maps/directions.
Meanwhile, photo printing, once the darling of home printing, has also declined substantially. In 2019, 34.2 million adults print photos with their home printers, as steep decline since 2016 levels of 48.1 million Americans. Sharing photos in person on their mobile device or over social networks has risen in popularity.
Home printing has also subsided for customarily work-related documents such as reports and presentations. This is due in part to employers increasingly moving their communications to electronic formats.
One surprise – printing photos from tablets has decreased, even while tablet use has steadily increased. Also, mobile users are becoming more comfortable with printing directly from their smartphone or tablet. The decline is due in large part to the ongoing decline in printing photos at all, regardless of device.
Shifts in major home printer activities
The top home printer activity is coupons, currently an activity of 65.6 million US adults. This is slightly lower than several years ago, in 2016, where this activity was occasionally done by 68.8 million Americans.
Meanwhile printing tickets has quickly risen from being done by 38.6 million adults in 2016 to 52.4 in 52.4 in 2019.
Home printing and presence of children
One group that historically prints more than average are adults with children in the household. Whether it’s printing homework, photos, or greeting cards, these households are simply busier with their technology.
Households with children continue to print more than those without, although this rate has dropped recently. Between 2017 and 2019, the average number of pages printed by adults with children has dropped from more than 50 pages per month to just over 40.
Are younger digital natives responsible for less printing?
No. The youngest adults (18-24) are printing as much as ever, and currently more than most older adults.
The largest drop in print volume is among adults age 25 to 44.
How are printer manufacturers innovating?
Convenience is key. Ink subscription services make it easier for home printer users to keep their printers ready. Wireless connections facilitate printing from PCs as well as smartphones and tablets. Touch screens and preview screens give users more control. Voice assistants allow for hands-off capabilities.
Expanded use: Multi-function printers include scanning capabilities
Ink subscription plans
Overall, 19% of online adults in the US subscribe to an ink replacement plan for their home printer.
Not all home printers are used equally
Wireless connections dominate active use. Wi-Fi connections allow printing from PCs throughout a home as well as those nearby the printer.
Printing from a smartphone are tablet are used, although at a much lower rate than penetration of those devices. Bluetooth printing is hardly used.
Scanning is widespread.
Remote printing is very low.
Voice assistant use is almost nonexistent.
Active features by brand
Epson stands out for having the most unique set of features actively used, each being used more often than by the users of other home printer brands.
Home printer volume by brand
What’s ahead for home printers?
Home printers will continue to have a place in US homes for many years, even as their activity levels may shrink. The top current printing activities, coupons and tickets, will be replaced slowly over time as consumers become more comfortable with having secure documents on their smartphones or tablets.
Personal records and incidental web pages will likely linger, as consumers continue to value having hard copy archival copies for safekeeping. Even though it might be argued that electronic cloud storage is more secure, the majority of users are only slowly understanding that.
Home printers will be retained and renewed, if only for the convenience of having one around just in case it is needed.
About TUPdates
TUPdates feature analysis of current or essential technology topics. The research results showcase the TUP/Technology User Profile study, MetaFacts’ survey of a representative sample of online adults profiling the full market’s use of technology products and services. The current wave of TUP is TUP/Technology User Profile 2020, which is TUP’s 38th annual. TUPdates may also include results from previous waves of TUP.
Current subscribers may use the comprehensive TUP datasets to obtain even more results or tailor these results to fit their chosen segments, services, or products. As subscribers choose, they may use the TUP inquiry service, online interactive tools, or analysis previously published by MetaFacts.
On request, interested research professionals can receive complimentary updates through our periodic newsletter. These include MetaFAQs – brief answers to frequently asked questions about technology users – or TUPdates – analysis of current and essential technology industry topics. To subscribe, contact MetaFacts.
Usage guidelines: This document may be freely shared within and outside your organization in its entirety and unaltered. It may not be used in a generative AI system without express written permission and licensing. To share or quote excerpts, please contact MetaFacts.
Dan Ness, Principal Analyst, MetaFacts, April 26, 2019
Users vote with their fingers, demonstrating what they like by what they actually use. The top combination includes four devices – a desktop, notebook, tablet, or smartphone – and actively used by one in six (16%) of online adults in the US.
This is based on the three most recent waves of Technology User Profile (TUP), the 2016 through 2018 waves. These were based on 7,336, 7,521, and 7,886 US online adult representative responses, respectively.
The top four combinations are used by over half (52%) of online Americans. All of the top combinations include a smartphone, three include a desktop, and two include a tablet. These major combinations have remained the most widely used for the last three years, representing the choice of around half of online Americans for the last three years.
Elders come on board
The average age of those using tablets or PCs without smartphones has dropped in the last year. Between 2017 and 2018, the average age of those using only a tablet – and no PC or smartphone – has dropped from 50.4 years old to 45.5. Similarly, those using a desktop and tablet and no smartphone has dropped from 53.8 years to 49.4. Those using 4 types of devices – a desktop, notebook, tablet, and smartphone, average 41.4 years old, in stark contrast to those using only a desktop, at 56 years old.
Looking ahead
Despite much media attention on this device or another “taking over the world”, most American users continue to juggle multiple devices.
Although innovative crossover products continue to make splashes and inroads, from foldable phones to all-in-one and convertibles, the majority of users persist in finding ways to stay productive and entertained with their varied types of devices. It seems users are currently more flexible than their devices.
About TUPdates
TUPdates feature analysis of current or essential technology topics. The research results showcase the TUP/Technology User Profile study, MetaFacts’ survey of a representative sample of online adults profiling the full market’s use of technology products and services. The current wave of TUP is TUP/Technology User Profile 2020, which is TUP’s 38th annual. TUPdates may also include results from previous waves of TUP.
Current subscribers may use the comprehensive TUP datasets to obtain even more results or tailor these results to fit their chosen segments, services, or products. As subscribers choose, they may use the TUP inquiry service, online interactive tools, or analysis previously published by MetaFacts.
On request, interested research professionals can receive complimentary updates through our periodic newsletter. These include MetaFAQs – brief answers to frequently asked questions about technology users – or TUPdates – analysis of current and essential technology industry topics. To subscribe, contact MetaFacts.
Usage guidelines: This document may be freely shared within and outside your organization in its entirety and unaltered. It may not be used in a generative AI system without express written permission and licensing. To share or quote excerpts, please contact MetaFacts.
Dan Ness, Principal Analyst, MetaFacts, March 15, 2019
Streaming subscriptions are popular, with 69% of online adults actively using at least one type of free or paid digital media subscription. Penetration is highest among younger than older American adults. Nearly nine in ten online adults in the US aged 18-34 use a digital media subscription. This is based on results from the 2018 wave of MetaFacts TUP/Technology User Profile, based on 7,886 respondents in the US, and 12,680 respondents across the US, UK, Germany, and India.
The majority of subscribers have a paid subscription – 85% of all online adults. Only a small percentage of users limit themselves to only free subscriptions, and that’s true across all age groups.
Paid streaming music has a lower overall penetration at 28% of online adults. There is a usage cliff after age 44, with penetration being much stronger among younger than older adults. Less than one in five adults age 45 to 54 use a paid media music subscription, and that rate is even lower among the age 55-64 (12%), and 65 or older (8% of online males and 6% of online females).
For streaming video, NetFlix is the long-established leader with the highest penetration. While adoption of the 1-screen plan is stronger than the 2-screen or 4-screen plan in the US and India, in the UK and Germany each plan has comparable use. Amazon’s Prime Video offering, although relatively more recent, has reached half the share of NetFlix in the US and UK, two-thirds in India, and near-parity in Germany.
Family plans have gained widespread use. Nearly half of US online household with 4 or more persons are actively using a paid family streaming plan from one of the major services: NetFlix, Apple, Spotify, or Deezer.
Comparing over-the-top (OTT) digital media subscriptions to traditional TV subscriptions, in the US, UK, and India, active OTT use surpasses the use of cable, satellite, or phone cable TV subscriptions. DVD rental, while diminished, is still a regular practice among nearly a fifth of online Americans, and 10% of online adults in India.
Looking ahead
When it comes to fun, art, and entertainment, there’s room for many outlets. Although many creators work hard to exclusively own, control and entice viewers and listeners, consumers are free to change their minds and they often do.
Consequently, I expect the majority of consumers to continue expanding their subscriptions, both in the number they use and the range of type of media they subscribe to. However, as content providers continue to jockey for position, joining and then leaving various services, consumers will continue to churn between services. Similarly, as existing providers continue to experiment with varied packages – from family and student to single and multi-screen – consumers will join in the experiments, with many switching and swapping between services. In other words, for years to come I expect two opposing forces. Consumers will pay for more than they use, primarily for the convenience of enjoyment when they want it. Also, consumers will continue with their subscriptions through inertia and confusion, without remembering which content is enabled through which subscription.
Although subscription fatigue may be growing in awareness, habit consumption will prevail over a reasoned review of subscriptions.
About TUPdates
TUPdates feature analysis of current or essential technology topics. The research results showcase the TUP/Technology User Profile study, MetaFacts’ survey of a representative sample of online adults profiling the full market’s use of technology products and services. The current wave of TUP is TUP/Technology User Profile 2020, which is TUP’s 38th annual. TUPdates may also include results from previous waves of TUP.
Current subscribers may use the comprehensive TUP datasets to obtain even more results or tailor these results to fit their chosen segments, services, or products. As subscribers choose, they may use the TUP inquiry service, online interactive tools, or analysis previously published by MetaFacts.
On request, interested research professionals can receive complimentary updates through our periodic newsletter. These include MetaFAQs – brief answers to frequently asked questions about technology users – or TUPdates – analysis of current and essential technology industry topics. To subscribe, contact MetaFacts.
Usage guidelines: This document may be freely shared within and outside your organization in its entirety and unaltered. It may not be used in a generative AI system without express written permission and licensing. To share or quote excerpts, please contact MetaFacts.
Dan Ness, Principal Analyst, MetaFacts, May 3, 2018
Millennials have been getting a bad rap lately, with pundits suggesting that they’re squandering their financial futures on avocado toast or cold brew. While our TUP study doesn’t track café treats, we’re finding robust spending on technology devices and services by millennials. Among millennials, homeowners outspend their home-renting counterparts by far.
Based on our most recent wave of TUP/Technology User Profile 2017 US – millennial homeowners are far more likely than millennial renters to be using an Apple Watch or Google Wear smartwatch. Furthermore, they’re well above all other groups in using tech devices they don’t own – such as an employer-provided mobile phone, e-book reader, or tablet. They stand out for having their nest feathered by entertainment devices such as home projectors and OTT TV devices such as an Amazon Fire TV or Google TV. Also, these digital feathernesters are more likely than average to be protecting their homes with smart locks and video doorbells.
Differences in tech usage by home ownership status are not only about age since Generation X homeowners are also well above GenX renters. Interestingly, the mix of devices used by GenX homeowners is like those used by Millennial homeowners, although at lower levels. Millennial homeowners are a substantial market segment, making up nearly one in four connected adults. This group is only slightly larger than the 20% which are GenX homeowners and 22% which are boomer homeowners. Renters are the smallest share of connected adults in every age group. Among millennials, a higher share is renters than the rate in other age groups, although homeowners still outnumber renters by nearly two to one.
Looking ahead
Millennial feathernesters have impressive plans, with their tech purchase intentions higher than any other age or home ownership group. Their plans which are strongly higher than the plans of other age and home ownership groups span nearly all types of devices: notebooks, tablets, and smartphones.
Home ownership status is less of a factor among GenX. Unlike the pattern among current tech users, GenX homeowners don’t have substantially stronger plans than do GenX renters. And among Baby Boomers, the pattern is slightly reversed. For many tech products, especially the most-mobile devices, a higher share of Boomer renters plan to purchase notebooks, tablets, smartphones, and desktop PCs than do Boomer homeowners.
Notes
For decades, MetaFacts has focused on research technology usage and adoption, and segmented users by a wide variety of sociodemographic and behavioral factors. This helps us support our wide variety of clients, some of who use different segmentation and analysis approaches that change over time. While many of our clients employ proprietary segmentation approaches, others seek to analyze the market using more publicly-available or convenient standards.
Analysis by age is one widely-used view, and often a productive starting point for deeper analysis. In some cases, age is a key component of the life stage, reflecting passages such as adulthood or retirement. In other cases, the birth year is used to identify a generational group. Segmentation approaches seek to identify groupings of people who as similar to each other as they are different from members of other groups.
For the analysis in this TUPdate, MetaFacts categorized online adults into the following age groups:
Millennial adult (born 1981-1999, age 18-36)
Generation X (born 1965-1980, age 37-52)
Baby Boomer (born 1946-1964, age 53-71)
Silent+Greatest Generation (born 1945 and before, age 72+)
In our standard TUP analysis, we often split Millennials and GenX into younger and older groups, since much of the technology adoption varies within each of these groups. MetaFacts continues to conduct custom analyses of the groupings that are the most useful concerning their use and adoption of technology, as well as concerning broader sociodemographic and behavioral analysis.
We’re also monitoring the ongoing discussion among the research community around the possible name of the next generation following Millennials. In January 2018, a New York Times reader request turned up suggestions such as “memelords”, “iGeneration”, “deltas”, or “Generation Z or GenZ”. https://www.nytimes.com/2018/01/31/style/generation-z-name.html
About TUPdates
TUPdates feature analysis of current or essential technology topics. The research results showcase the TUP/Technology User Profile study, MetaFacts’ survey of a representative sample of online adults profiling the full market’s use of technology products and services. The current wave of TUP is TUP/Technology User Profile 2020, which is TUP’s 38th annual. TUPdates may also include results from previous waves of TUP.
Current subscribers may use the comprehensive TUP datasets to obtain even more results or tailor these results to fit their chosen segments, services, or products. As subscribers choose, they may use the TUP inquiry service, online interactive tools, or analysis previously published by MetaFacts.
On request, interested research professionals can receive complimentary updates through our periodic newsletter. These include MetaFAQs – brief answers to frequently asked questions about technology users – or TUPdates – analysis of current and essential technology industry topics. To subscribe, contact MetaFacts.
Usage guidelines: This document may be freely shared within and outside your organization in its entirety and unaltered. It may not be used in a generative AI system without express written permission and licensing. To share or quote excerpts, please contact MetaFacts.
Dan Ness, Principal Analyst, MetaFacts, April 10, 2018
Younger adults are moving away from Facebook, even while they continue to use other social networks.
The highest share of adults actively using social networks, although not using Facebook, are adults age 18 to 24. The highest share is among males age 18 to 24, with 15% doing so. That is closely followed by females age 18-24 with 11% doing so.
These two gender/age segments were also the top two Facebook-avoiding groups a year earlier. As we reported in TUP 2016, 14% of males age 18-24 and 12% of females age 18-24 were active social networkers not using Facebook.
Also, this is part of a continuing and growing trend. In TUP 2015 we reported that 10% of males age 18 to 24 and 10% of females age 18 to 24 were active social networkers not using Facebook.
About TUPdates
These results are based on results of the MetaFacts TUP/Technology User Profile 2017 survey, its 35th consecutive wave, as well as previous waves.
TUPdates feature analysis of current or essential technology topics. The research results showcase the TUP/Technology User Profile study, MetaFacts’ survey of a representative sample of online adults profiling the full market’s use of technology products and services. The current wave of TUP is TUP/Technology User Profile 2020, which is TUP’s 38th annual. TUPdates may also include results from previous waves of TUP.
Current subscribers may use the comprehensive TUP datasets to obtain even more results or tailor these results to fit their chosen segments, services, or products. As subscribers choose, they may use the TUP inquiry service, online interactive tools, or analysis previously published by MetaFacts.
On request, interested research professionals can receive complimentary updates through our periodic newsletter. These include MetaFAQs – brief answers to frequently asked questions about technology users – or TUPdates – analysis of current and essential technology industry topics. To subscribe, contact MetaFacts.
Usage guidelines: This document may be freely shared within and outside your organization in its entirety and unaltered. It may not be used in a generative AI system without express written permission and licensing. To share or quote excerpts, please contact MetaFacts.