Dan Ness, Principal Analyst, MetaFacts, March 25, 2021
American parents of school-age children actively use home PCs. There is a difference by whether the adult is male or female. This MetaFAQs reports on the number of home PCs being actively used among adults with school-age children (age 6-17) split by the gender of the adult.
Usage guidelines: This document may be freely shared within and outside your organization in its entirety and unaltered. It may not be used in a generative AI system without express written permission and licensing. To share or quote excerpts, please contact MetaFacts.
Dan Ness, Principal Analyst, MetaFacts, March 24, 2021
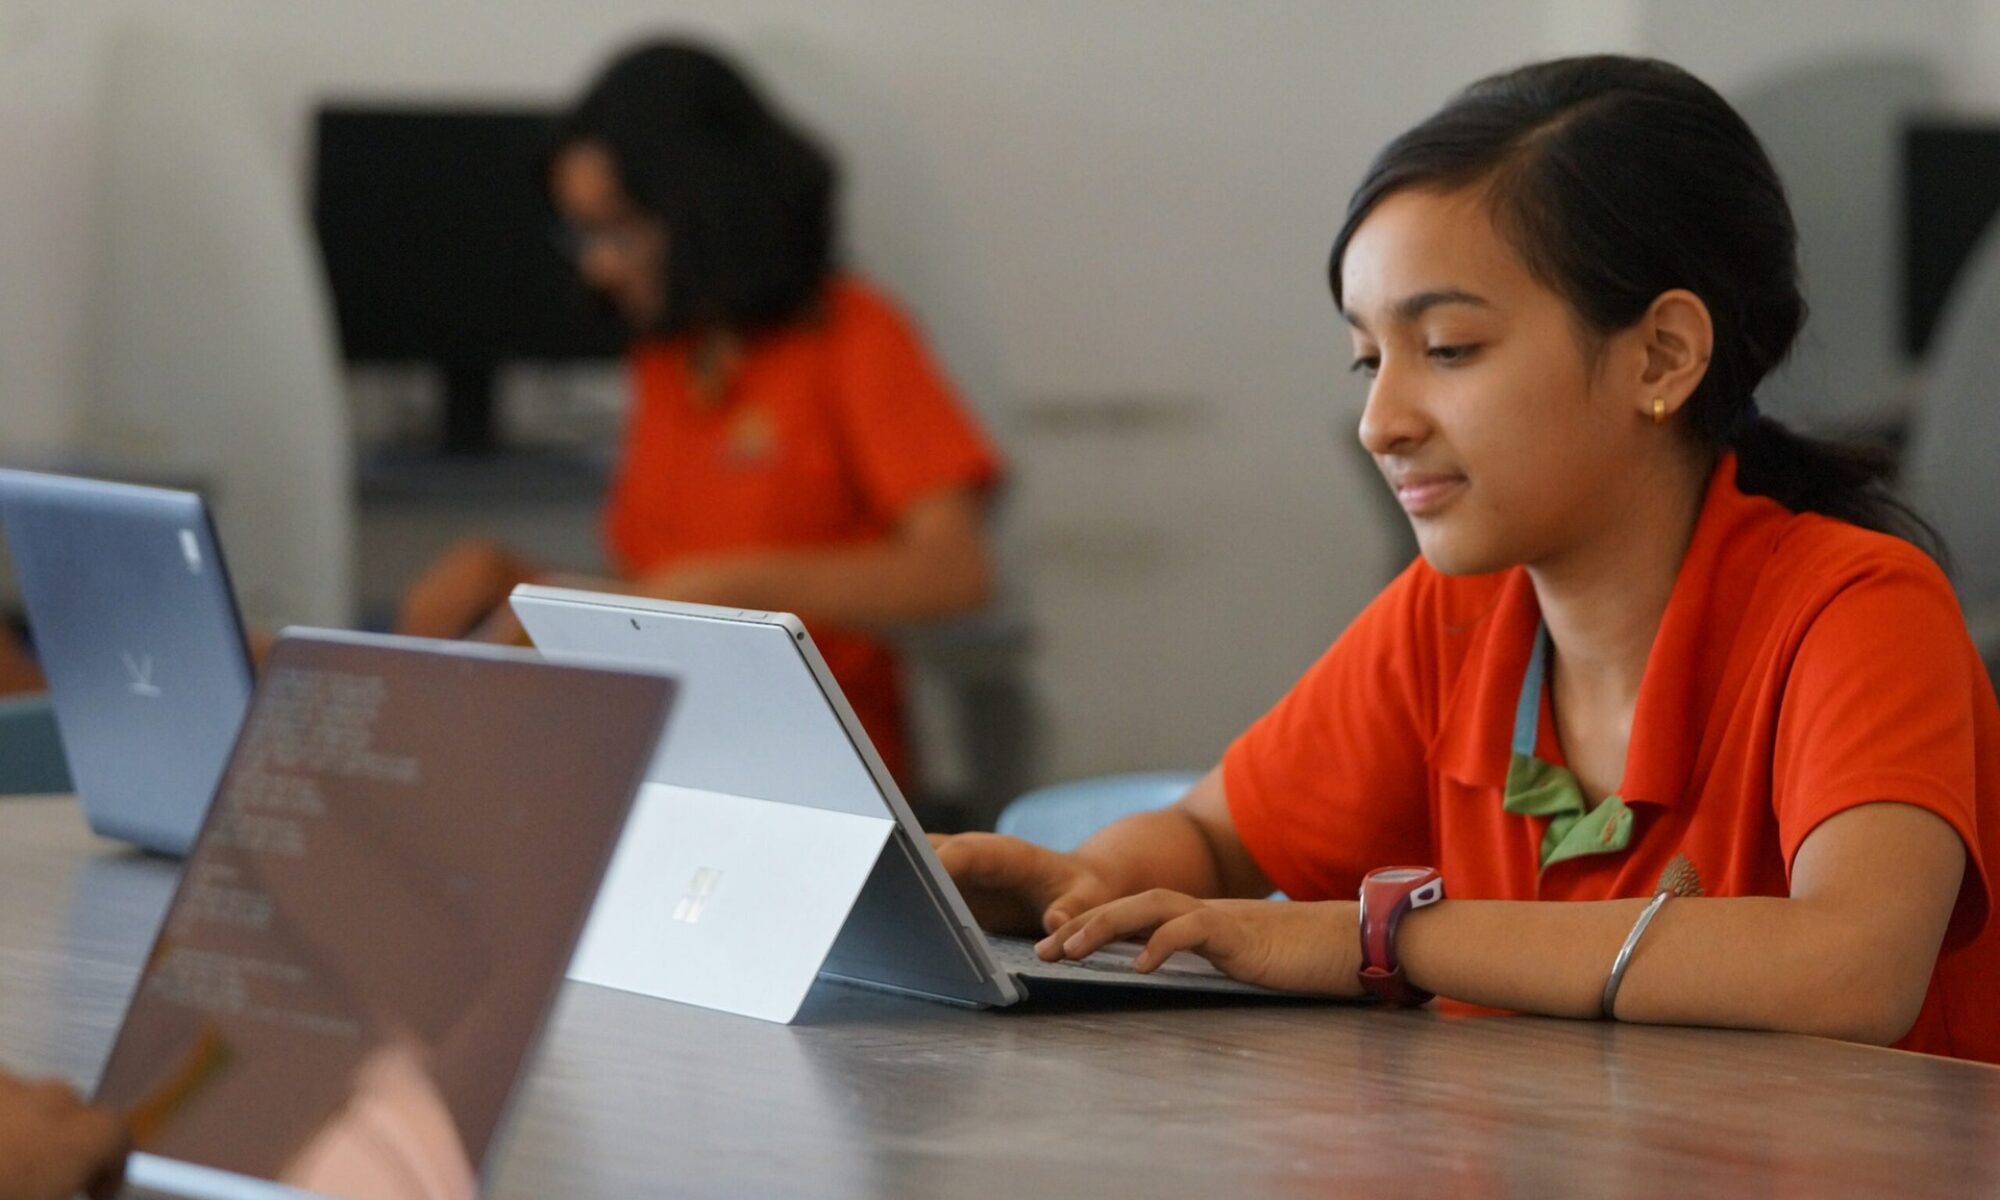
There are many ways for school-age children to get help with their schoolwork. This MetaFAQs looks at the connected devices that adults regularly use to help – PCs, smartphones, or tablets.
Usage guidelines: This document may be freely shared within and outside your organization in its entirety and unaltered. It may not be used in a generative AI system without express written permission and licensing. To share or quote excerpts, please contact MetaFacts.
Dan Ness, Principal Analyst, MetaFacts, March 23, 2021
During pandemic times, many school-age children, especially younger ones, are getting their education at home. This MetaFAQs reports on adults’ connected devices for children’s schoolwork and other educational activities. We have split the results by device type – home PC, smartphone, tablet, or work PC – and country – the US, Germany, the UK, and Japan.
About MetaFAQs
MetaFAQs are answers to frequently asked questions about technology users. The research results showcase the TUP/Technology User Profile study, MetaFacts’ survey of a representative sample of online adults profiling the full market’s use of technology products and services. The current wave of TUP is TUP/Technology User Profile 2020, which is TUP’s 38th annual.
Current subscribers may use the comprehensive TUP datasets to obtain even more results or tailor these results to fit their chosen segments, services, or products. As subscribers choose, they may use the TUP inquiry service, online interactive tools, or analysis previously published by MetaFacts.
On request, interested research professionals can receive complimentary updates through our periodic newsletter. These include MetaFAQs – brief answers to frequently asked questions about technology users – or TUPdates – analysis of current and essential technology industry topics. To subscribe, contact MetaFacts.
Usage guidelines: This document may be freely shared within and outside your organization in its entirety and unaltered. It may not be used in a generative AI system without express written permission and licensing. To share or quote excerpts, please contact MetaFacts.
Dan Ness, Principal Analyst, MetaFacts, March 20, 2021
Do more or fewer Dads use technology products than Moms? If there are differences, which devices are used most often by either? Is there much of a gap in their usage? This MetaFAQs reports on the penetration of crucial connected devices among adults with school-age children (6-17) by gender.
Usage guidelines: This document may be freely shared within and outside your organization in its entirety and unaltered. It may not be used in a generative AI system without express written permission and licensing. To share or quote excerpts, please contact MetaFacts.
Dan Ness, Principal Analyst, MetaFacts, November 16, 2020
Home printers are used for a wide variety of activities. Those involving children – from homework to photos – spur higher printer usage. This MetaFAQs reports on the average number of pages being printed with home printers in the US, split by whether or not there are children in the household.
Usage guidelines: This document may be freely shared within and outside your organization in its entirety and unaltered. It may not be used in a generative AI system without express written permission and licensing. To share or quote excerpts, please contact MetaFacts.
Working from home. While it is a blessing for some and may feel like a curse for others, only the few get the privilege. Being able to work from home during widespread public health safety shutdowns has sustained employment for many employees. It has also brought new challenges for those with school-age children or insufficient technology. It has also brought about faster adoption of certain technology products and services while revealing long-present sociological differences. The differences may persist while many of the technological changes will be temporary and evolutionary, not revolutionary.
One in four online Americans are working from home
As of May 14th, 2020, one fourth of online Americans (26%) were working at home. This represents 60% of online Americans employed full-time or part-time on May 14th, 2020. Most of these only started working from home recently. Almost half (48%) of employed online American adults started working from home after February 2020.
Rise in online Americans not employed
Also, as of May 14th, 43% of online Americans were employed full-time or part-time, 8% were self-employed, and 19% reported being temporarily or seasonally unemployed.
Note that 19% rate is not a directly comparable measure to the widely followed U3 unemployment rate from the BLS, which represents active jobseekers. Instead, it is closer in methodology to the U6 rate, which includes discouraged and unemployed workers not actively seeking employment. However, since this survey only included online respondents, offline or disconnected Americans are not included in these results. Their inclusion would make the overall percentage of American adults working from home somewhat lower.
Working at home is strongest among upper socioeconomic groups
Working at home is strongly associated with socioeconomic factors.
A higher share of those with higher educational attainment and household income are working from home. For those with graduate degrees, the rate (56%) is double the national average. In stark contrast, only 7% of employees whose highest educational attainment is high school are working from home, and only 14% of those who have completed some college.
Similarly, higher paid employees have a higher work-from-home rate, at 42% for those with a household income of $85,000 or higher.
Salary and education only two factors explaining higher work-at-home rates. Many occupations do not lend themselves well to working at home. Also, some employers have not embraced having employees work remotely nor have some employers prepared adequately.
The work from home privileged group – from more to even more
The remote workplace has shifted even further in the five weeks between our April 2nd and May 14th surveys, especially for higher socioeconomic groups. Overall, the work-at-home rate grew somewhat from just over half (54%) to 60% of American employees.
Two measures of socioeconomic status – educational attainment and household income – are positively associated with the fastest-growing groups to work at home. The rates of post-graduate employees working at home has grown from 80% to 93% Also, adults in households with incomes of $85,000 or higher have risen slightly from two-thirds (67%) to 71%.
Adults in homes with children have also grown in their work-at-home rates, rising from two-thirds (67%) to 77%.
Technology usage shifts among the work-at-homes
PC use is dramatically different among American employees working from home than those not working from home. Among employees working from home, the mean number of weekly hours is 58.3, substantially more than those not working from home, 22.2 hours per week. A PC is necessary for many work-related tasks, from spreadsheets to collaborative documents.
One of the fastest growing activities – video conferencing – is possible with a smartphone. Despite this, smartphone hours are not measurably higher among those working from home than those not working from home.
Looking ahead
The underlying socioeconomic differences we have seen exposed so far in the pandemic are unlikely to change. They are systemic and have been in place for generations. Further reinforcing these persistent differences, technology has enabled many employees to work from home, although primarily those upper socioeconomic groups. These differences will further separate the haves from the have-nots.
One major technological shift has been around the adoption of videoconferencing. As I have reported in other MetaFacts Pulse surveys earlier this year, groups from seniors to employees and parents have rapidly adopted video conferencing for both personal and work-related calls and conferences. These groups have not been quite as quick to adopt any new technology they had never used. Instead, most are using whatever technology they already had in place, such as a home PC. There has been some supplementing of in-home technology with better webcams and other small peripherals. With economic insecurity both among employers and citizens, many have delayed making capital purchases. Very few employees, so far, have been assisted with employer-provided technology such as new PCs, printers, or VPNs.
There is still much uncertainty today about whether businesses will continue to allow employees to work from home after such time governmental health authorities say it is safe to have workers return their previous workplaces.
Within three years, presuming the virus is no longer causing a pandemic, I expect only half of today’s video users to be regularly doing this practice. That may seem like a dramatic drop. I expect a retreat from video as people spend time again at their workplaces or schools. They will be having in-person meetings again, taking the place of work video meetings. Or, many will be meeting in person with friends or family instead of making that FaceTime or Zoom call.
That will still leave a substantial number of people working remotely, collaborating electronically, and connecting through video calls or conferences. The genie is out of the bottle.
About TUPdates
The information referred to in this special TUPdate is based on independent research conducted by MetaFacts.
TUPdates feature analysis of current or essential technology topics. The research results showcase the TUP/Technology User Profile study, MetaFacts’ survey of a representative sample of online adults profiling the full market’s use of technology products and services. The current wave of TUP is TUP/Technology User Profile 2020, which is TUP’s 38th annual. TUPdates may also include results from previous waves of TUP.
Current subscribers may use the comprehensive TUP datasets to obtain even more results or tailor these results to fit their chosen segments, services, or products. As subscribers choose, they may use the TUP inquiry service, online interactive tools, or analysis previously published by MetaFacts.
On request, interested research professionals can receive complimentary updates through our periodic newsletter. These include MetaFAQs – brief answers to frequently asked questions about technology users – or TUPdates – analysis of current and essential technology industry topics. To subscribe, contact MetaFacts.
Usage guidelines: This document may be freely shared within and outside your organization in its entirety and unaltered. It may not be used in a generative AI system without express written permission and licensing. To share or quote excerpts, please contact MetaFacts.
Working from home. While it is a blessing for some and may feel like a curse for others, only a few get the privilege. Being able to work from home during widespread public health safety shutdowns has sustained employment for many employees. It has also brought new challenges for those with school-age children or insufficient technology. It has also brought about faster adoption of certain technology products and services while revealing long-present sociological differences. The differences may persist while many of the technological changes will be temporary and evolutionary, not revolutionary.
One in four online Americans are working from home
As of May 14th, 2020, one-fourth of online Americans (26%) were working at home. This represents 60% of online Americans employed full-time or part-time on May 14th, 2020. Most of these only started working from home recently. Almost half (48%) of employed online American adults started working from home after February 2020.
Rise in online Americans not employed
Also, as of May 14th, 43% of online Americans were employed full-time or part-time, 8% were self-employed, and 19% reported being temporarily or seasonally unemployed.
Note that the 19% rate is not a directly comparable measure to the widely followed U3 unemployment rate from the BLS, which represents active jobseekers. Instead, it is closer in methodology to the U6 rate, which includes discouraged and unemployed workers not actively seeking employment. However, since this survey only included online respondents, offline or disconnected Americans are not included in these results. Their inclusion would make the overall percentage of American adults working from home somewhat lower.
Working at home is strongest among upper socioeconomic groups
Working at home is strongly associated with socioeconomic factors.
A higher share of those with higher educational attainment and household income are working from home. For those with graduate degrees, the rate (56%) is double the national average. In stark contrast, only 7% of employees whose highest educational attainment is high school are working from home, and only 14% of those who have completed some college.
Similarly, higher-paid employees have a higher work-from-home rate, at 42% for those with a household income of $85,000 or higher.
Salary and education only two factors explaining higher work-at-home rates. Many occupations do not lend themselves well to working at home. Also, some employers have not embraced having employees work remotely nor have some employers prepared adequately.
The work from home privileged group – from more to even more
The remote workplace has shifted even further in the five weeks between our April 2nd and May 14th surveys, especially for higher socioeconomic groups. Overall, the work-at-home rate grew somewhat from just over half (54%) to 60% of American employees.
Two measures of socioeconomic status – educational attainment and household income – are positively associated with the fastest-growing groups to work at home. The rates of post-graduate employees working at home have grown from 80% to 93% Also, adults in households with incomes of $85,000 or higher have risen slightly from two-thirds (67%) to 71%.
Adults in homes with children have also grown in their work-at-home rates, rising from two-thirds (67%) to 77%.
Technology usage shifts among the work-at-homes
PC use is dramatically different among American employees working from home than those not working from home. Among employees working from home, the mean number of weekly hours is 58.3, substantially more than those not working from home, 22.2 hours per week. A PC is necessary for many work-related tasks, from spreadsheets to collaborative documents.
One of the fastest-growing activities – video conferencing – is possible with a smartphone. Despite this, smartphone hours are not measurably higher among those working from home than those not working from home.
Looking ahead
The underlying socioeconomic differences we have seen exposed so far in the pandemic are unlikely to change. They are systemic and have been in place for generations. Further reinforcing these persistent differences, technology has enabled many employees to work from home, although primarily those upper socioeconomic groups. These differences will further separate the haves from the have-nots.
One major technological shift has been around the adoption of videoconferencing. As I have reported in other MetaFacts Pulse surveys earlier this year, groups from seniors to employees and parents have rapidly adopted video conferencing for both personal and work-related calls and conferences. These groups have not been quite as quick to adopt any new technology they had never used. Instead, most are using whatever technology they already had in place, such as a home PC. There has been some supplementing of in-home technology with better webcams and other small peripherals. With economic insecurity both among employers and citizens, many have delayed making capital purchases. Very few employees, so far, have been assisted with employer-provided technology such as new PCs, printers, or VPNs.
There is still much uncertainty today about whether businesses will continue to allow employees to work from home after such time governmental health authorities say it is safe to have workers return to their previous workplaces.
Within three years, presuming the virus is no longer causing a pandemic, I expect only half of today’s video users to be regularly doing this practice. That may seem like a dramatic drop. I expect a retreat from video calling and meetings as people spend time again at their workplaces or schools. They will be having in-person meetings again, taking the place of work video meetings. Or, many will be meeting in person with friends or family instead of making that FaceTime or Zoom call.
That will still leave a substantial number of people working remotely, collaborating electronically, and connecting through video calls or conferences. The genie is out of the bottle.
About this TUPdate
The information referred to in this special TUPdate is based on independent research conducted by MetaFacts.
This TUPdate included results from the May 14th, 2020 wave of the MetaFacts Pulse adult survey.
Resources
Current TUP/Technology User Profile subscribers may request the supporting TUP information used for this analysis or for even deeper analysis. Subscribers to the MetaFacts Employees Pulse surveys may request the supporting information and can make additional inquiries. For more information about MetaFacts and subscribing to TUP or the MetaFacts Pulse surveys, please contact MetaFacts.
Usage guidelines: This document may be freely shared within and outside your organization in its entirety and unaltered. It may not be used in a generative AI system without express written permission and licensing. To share or quote excerpts, please contact MetaFacts.
Dan Ness, Principal Analyst, MetaFacts, January 2, 2020
Home PC penetration is stable
Home PCs continue to be a feature of online Americans. Four out of five online American adults regularly use a home PC, and this share has remained unchanged from 2015 through 2019. This is based on results from the 2015 through 2019 waves of TUP/Technology User Profile.
Use of more than one home PC has also remained stable. Half of online adults use only one home PC, a rate that has only varied by three percent over five years. Similarly, the usage rate has remained the same for the use of two home PCs and for three or more home PCs. Neither are online Americans accumulating or letting go of home PCs.
Home PC use by age group
Across all age groups, most online Americans use only one home PC. Single home PC use is lowest among younger adults and highest among older adults. Use of two or more home PCs is hardly different by age group, ranging from 26% to 31%.
In 2015, the patterns were similar. Home PC usage among younger adults is slightly lower, at 28% of those age 18-24 in 2019, down from 25% in 2015, although this drop is not material.
Doubling and tripling up among the young
Home PC penetration has stayed strong while smartphone and tablet penetration has grown, especially among younger adults. In 2019, smartphone penetration is higher than home PC penetration among online adults age 54 and younger. Tablet use is highest among adults age 25-44, strong users of all three devices.
Looking ahead
Habits die hard, and consumers hold onto some technology as a safeguard. Home PCs are likely to maintain their penetration levels for the next decade. However, TUP has already shown that home PCs have been losing their preeminence to smartphones as the primary device of choice for most activities. So, consumers will retain and replace home PCs as an insurance policy for those times when they are more convenient than either smartphones or tablets.
About TUPdates
TUPdates feature analysis of current or essential technology topics. The research results showcase the TUP/Technology User Profile study, MetaFacts’ survey of a representative sample of online adults profiling the full market’s use of technology products and services. The current wave of TUP is TUP/Technology User Profile 2020, which is TUP’s 38th annual. TUPdates may also include results from previous waves of TUP.
Current subscribers may use the comprehensive TUP datasets to obtain even more results or tailor these results to fit their chosen segments, services, or products. As subscribers choose, they may use the TUP inquiry service, online interactive tools, or analysis previously published by MetaFacts.
On request, interested research professionals can receive complimentary updates through our periodic newsletter. These include MetaFAQs – brief answers to frequently asked questions about technology users – or TUPdates – analysis of current and essential technology industry topics. To subscribe, contact MetaFacts.
Usage guidelines: This document may be freely shared within and outside your organization in its entirety and unaltered. It may not be used in a generative AI system without express written permission and licensing. To share or quote excerpts, please contact MetaFacts.
Dan Ness, Principal Analyst, MetaFacts, November 7, 2019
Overview
Printing at home has changed in recent years. Printer manufacturers continue to innovate in order to compete and encourage broad active printer use.
This TUPdate looks at the major trends in home printing in the US, and examines how users have changed in both what they print and their volume of printing. Also, it examines printing trends with respect to the broadened use of mobile devices. Further, it looks into whether younger adults print more or less than older ones, and whether presence of children makes a difference.
The source for this analysis is MetaFacts TUP/Technology User Profile, with results from waves 2015 through 2019, all based on surveys of from 7,326 to 8,060 online adults in the US.
Home printer penetration
The majority of online adults in the US use a home printer, although market penetration has dropped over the last two years.
In 2019, 68% of online adults in the US actively use a home printer. This is effectively the same level as in 2018 – 67%. However, this share had been a stable 73% between 2015 to 2017.
The decline has been driven by substitutes, primarily increased use mobile devices
Home printer page volume has declined
While the penetration of home printers has dropped slowly then stabilized, the number of pages being printed has dropped faster.
The average number of pages printed per month has dropped from 38.6 per month in 2015 to 31.8 in 2019, a reduction of nearly 20%.
Mobile substitutes for printing
One of the biggest contributors to the decline in printing – the mass move to mobile platforms. Americans are increasingly using their smartphones to find their way instead of printing maps or directions. That change is happening surely yet slowly.
It may surprise many digital natives that as many as 43.7 million Americans still occasionally print maps/directions.
Meanwhile, photo printing, once the darling of home printing, has also declined substantially. In 2019, 34.2 million adults print photos with their home printers, as steep decline since 2016 levels of 48.1 million Americans. Sharing photos in person on their mobile device or over social networks has risen in popularity.
Home printing has also subsided for customarily work-related documents such as reports and presentations. This is due in part to employers increasingly moving their communications to electronic formats.
One surprise – printing photos from tablets has decreased, even while tablet use has steadily increased. Also, mobile users are becoming more comfortable with printing directly from their smartphone or tablet. The decline is due in large part to the ongoing decline in printing photos at all, regardless of device.
Shifts in major home printer activities
The top home printer activity is coupons, currently an activity of 65.6 million US adults. This is slightly lower than several years ago, in 2016, where this activity was occasionally done by 68.8 million Americans.
Meanwhile printing tickets has quickly risen from being done by 38.6 million adults in 2016 to 52.4 in 52.4 in 2019.
Home printing and presence of children
One group that historically prints more than average are adults with children in the household. Whether it’s printing homework, photos, or greeting cards, these households are simply busier with their technology.
Households with children continue to print more than those without, although this rate has dropped recently. Between 2017 and 2019, the average number of pages printed by adults with children has dropped from more than 50 pages per month to just over 40.
Are younger digital natives responsible for less printing?
No. The youngest adults (18-24) are printing as much as ever, and currently more than most older adults.
The largest drop in print volume is among adults age 25 to 44.
How are printer manufacturers innovating?
Convenience is key. Ink subscription services make it easier for home printer users to keep their printers ready. Wireless connections facilitate printing from PCs as well as smartphones and tablets. Touch screens and preview screens give users more control. Voice assistants allow for hands-off capabilities.
Expanded use: Multi-function printers include scanning capabilities
Ink subscription plans
Overall, 19% of online adults in the US subscribe to an ink replacement plan for their home printer.
Not all home printers are used equally
Wireless connections dominate active use. Wi-Fi connections allow printing from PCs throughout a home as well as those nearby the printer.
Printing from a smartphone are tablet are used, although at a much lower rate than penetration of those devices. Bluetooth printing is hardly used.
Scanning is widespread.
Remote printing is very low.
Voice assistant use is almost nonexistent.
Active features by brand
Epson stands out for having the most unique set of features actively used, each being used more often than by the users of other home printer brands.
Home printer volume by brand
What’s ahead for home printers?
Home printers will continue to have a place in US homes for many years, even as their activity levels may shrink. The top current printing activities, coupons and tickets, will be replaced slowly over time as consumers become more comfortable with having secure documents on their smartphones or tablets.
Personal records and incidental web pages will likely linger, as consumers continue to value having hard copy archival copies for safekeeping. Even though it might be argued that electronic cloud storage is more secure, the majority of users are only slowly understanding that.
Home printers will be retained and renewed, if only for the convenience of having one around just in case it is needed.
About TUPdates
TUPdates feature analysis of current or essential technology topics. The research results showcase the TUP/Technology User Profile study, MetaFacts’ survey of a representative sample of online adults profiling the full market’s use of technology products and services. The current wave of TUP is TUP/Technology User Profile 2020, which is TUP’s 38th annual. TUPdates may also include results from previous waves of TUP.
Current subscribers may use the comprehensive TUP datasets to obtain even more results or tailor these results to fit their chosen segments, services, or products. As subscribers choose, they may use the TUP inquiry service, online interactive tools, or analysis previously published by MetaFacts.
On request, interested research professionals can receive complimentary updates through our periodic newsletter. These include MetaFAQs – brief answers to frequently asked questions about technology users – or TUPdates – analysis of current and essential technology industry topics. To subscribe, contact MetaFacts.
Usage guidelines: This document may be freely shared within and outside your organization in its entirety and unaltered. It may not be used in a generative AI system without express written permission and licensing. To share or quote excerpts, please contact MetaFacts.