Dan Ness, Principal Analyst, MetaFacts, November 7, 2018
While pundits puzzle and debate, consumers lead the way. Is an iPad a computer, have smartphones replaced other mobile devices, and are PCs dead? Consumers continue to find their own ways and use what they choose, defying definitions, headlines, and experts. From among three dominant operating system ecosystems and three main types of mobile devices, home consumers have found their favorites.
Usage guidelines: This document may be freely shared within and outside your organization in its entirety and unaltered. It may not be used in a generative AI system without express written permission and licensing. To share or quote excerpts, please contact MetaFacts.
Dan Ness, Principal Analyst, MetaFacts, October 30, 2018
Vinyl turntables?! Windows XP?! Basic cell phones?!
Is it true that users of older technology are uninterested in new technology? We tested that hypothesis using several indicators, and found that this stereotype is partly true, and partly not true. We’ve found an interesting group that spans the old and the new, and who are distinct from those who match the laggard stereotype.
Users of older technology are a substantial part of the marketplace. While some slog along with what they have, others eagerly anticipate and even create the future. More pedestrian ones hold on to what they have because they aren’t seeing the value in new technology products and services, or don’t have the means or motivation to do so.
Based on our most research results, from the MetaFacts Technology User Profile (TUP) 2018 wave, 18% of online adults globally use a basic feature phone and 4% use a turntable to play vinyl records. This is based on our balanced survey of 14,273 adults actively online using any PC, mobile phone, tablet, or game console.
Many types of older products are also in everyday use. One in eight (12%) of the primary PC being used by adults was acquired in 2013, two years before Windows 10 was released to the public. One in twelve online adults (8%) are using a printer as old, and one in sixteen (6%) are using a tablet also from 2013 or earlier.
Old-school isn’t necessarily old, as vinyl record turntables have toyed with a resurgence over the last decade. They’ve recently withered into usage by only one in twenty-five (4%) online adults.
However, this small and stalwart group has substantially broader and more ambitious technology purchase plans than most online adults, and certainly more than those who simply hang on to old PCs, tablets, or printers.
Turntable users are 3.5 times as likely, or more, to be planning to purchase a 3D printer, home projector, or portable Wi-Fi hotspot. They also stand out for their strong interest in Google Android/Chrome devices – whether a Chromebook, Chrome desktop, or a Wi-Fi Android tablet. They also have the highest intentions to purchase an Apple iPod Touch, the almost-iPhone quietly targeted as a music-playing or social communication device.
These same technology products have lured the interest of another group – basic feature phone users – although to a lesser extent. These simple cellphone users have above-average intentions for each of these same products.
Do these mean that the future for 3D printers and Chromebooks is only among these small segments? Not necessarily. It means that innovation and openness attract other segments besides the newest-technology crowd.
In fact, the desires and intentions of these music-loving, vinyl-spinning innovation and novelty seekers run circles around the average online adult.
About TUPdates
TUPdates feature analysis of current or essential technology topics. The research results showcase the TUP/Technology User Profile study, MetaFacts’ survey of a representative sample of online adults profiling the full market’s use of technology products and services. The current wave of TUP is TUP/Technology User Profile 2020, which is TUP’s 38th annual. TUPdates may also include results from previous waves of TUP.
Current subscribers may use the comprehensive TUP datasets to obtain even more results or tailor these results to fit their chosen segments, services, or products. As subscribers choose, they may use the TUP inquiry service, online interactive tools, or analysis previously published by MetaFacts.
On request, interested research professionals can receive complimentary updates through our periodic newsletter. These include MetaFAQs – brief answers to frequently asked questions about technology users – or TUPdates – analysis of current and essential technology industry topics. To subscribe, contact MetaFacts.
Usage guidelines: This document may be freely shared within and outside your organization in its entirety and unaltered. It may not be used in a generative AI system without express written permission and licensing. To share or quote excerpts, please contact MetaFacts.
Dan Ness, Principal Analyst, MetaFacts, October 19, 2018
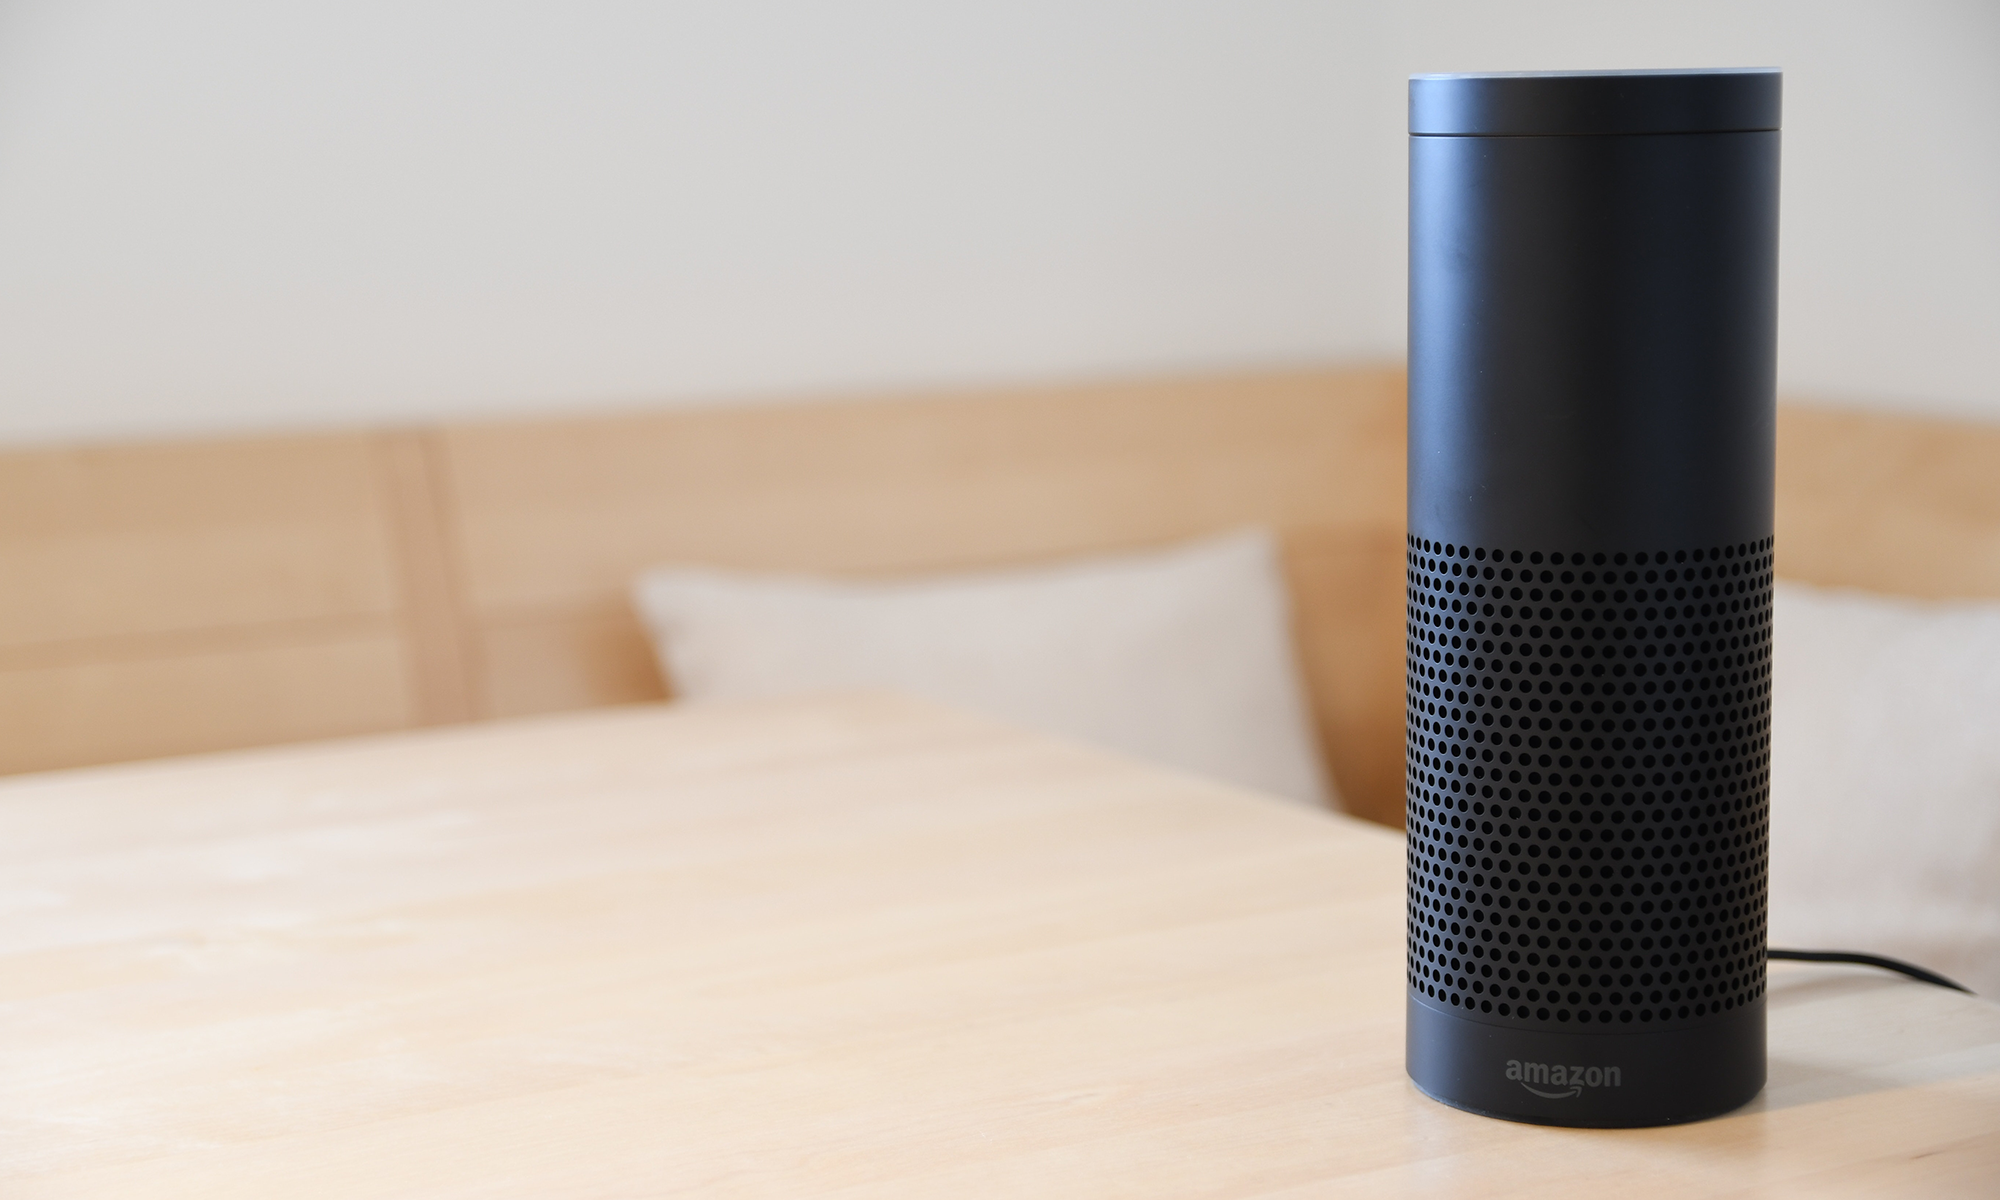
Convenience is the surest bet to reach technology consumers. When it comes to voice assistants, convenience must be handy. It shouldn’t be surprising that consumers first choose what’s familiar and close to hand. More are actively speaking to devices they’ve already had before using smart speakers.
Among American adults, five times as many use a smartphone than a smart speaker to access a voice assistant. This is based on results from the most recent wave of TUP/Technology User Profile. Nearly half, 46%, of online adults in the US used a smartphone to access a voice assistant such as Apple Siri. One in five, 20%, used a tablet. Smart speakers, such as an Amazon Echo or Dot were only being used by one in eleven, 9%, of online US adults.
Among those using a smartphone to reach their voice assistant, the median household spending for technology devices and services for the full prior year of 2017 is $4,500. By comparison, those using a tablet to reach their voice assistant average $6,750, and those using a smart speaker average $6,560.
At first glance, it may seem compelling that smart speaker users are much bigger spenders. Their median spending for home technology devices and services is double the average online adult. However, tablets are more compelling. Those who use tablets to reach their voice assistants spend a bit more than smart speaker users, at $6,750. More importantly, they are more numerous. In fact, there are more than twice as many, with tablet voice assistant users making up 20% of online adults.
Looking at total spending, smartphone voice assistant users are putting their money where their mouth is. Although their average spending on technology devices and services is lower than users of tablets or speaker voice assistants, there are so many more of them that their total spending is higher.
Looking ahead
Consumers are still experimenting with voice assistants, regardless of device. Although smart speakers are getting a lot of attention, it’s worth keeping an eye, and ear, on tablets and smartphones. After all, money talks.
About TUPdates
These results are based on results of the MetaFacts Technology User Profile 2018 survey, its 36th consecutive wave.
TUPdates feature analysis of current or essential technology topics. The research results showcase the TUP/Technology User Profile study, MetaFacts’ survey of a representative sample of online adults profiling the full market’s use of technology products and services. The current wave of TUP is TUP/Technology User Profile 2020, which is TUP’s 38th annual. TUPdates may also include results from previous waves of TUP.
Current subscribers may use the comprehensive TUP datasets to obtain even more results or tailor these results to fit their chosen segments, services, or products. As subscribers choose, they may use the TUP inquiry service, online interactive tools, or analysis previously published by MetaFacts.
On request, interested research professionals can receive complimentary updates through our periodic newsletter. These include MetaFAQs – brief answers to frequently asked questions about technology users – or TUPdates – analysis of current and essential technology industry topics. To subscribe, contact MetaFacts.
Usage guidelines: This document may be freely shared within and outside your organization in its entirety and unaltered. It may not be used in a generative AI system without express written permission and licensing. To share or quote excerpts, please contact MetaFacts.
Dan Ness, Principal Analyst, MetaFacts, October 10, 2018
This week, Google announced they’ll be pulling the plug on the consumer-facing Google+, although after unreported widening abandonment. Google’s social network rocket never quite left orbit and was already on its way down. Although the decision was partly portrayed as protecting user’s privacy, recently a substantial number of Google+ users had already abandoned the platform.
In the last year, a substantial number of Google+ users stopped returning. This is based on the results of our independent survey, TUP/Technology User Profile, conducted continuously since 1983. From mid-2014 through mid-2017, Google+ had continued its steady, but stagnant, usage patterns. During that time, the number of active US adult users hovered between 41.7 and 48.6 million. Even before Google announced the closure of Google+, we found in our most recent wave of TUP, fielded mid-year 2018, that the number of Google+ users had dropped nearly in half, to 25.2 million users.
The final Google+ hangers-on form a unique profile, especially for the sites they frequent. They are three times more likely than the average online adult to be active on MySpace, and twice as likely to be using Viber, Reddit, Imgur, or Tumblr.
Demographically, usage levels plummeted simultaneously for all age and gender groups. At one peak point in 2015, 43% of online males age 25 to 34 were using Google+. By 2018, that plummeted to 14%.
The remaining users are not from any particular gender or age group, as all have penetration rates in the teens.
Looking ahead
Even though Google’s announcement hinted they may refocus Google+ on enterprise users, these are also few in number. In fact, a higher-than-average share of remaining Google+ users are unemployed or employed part-time.
Google’s sunsetting may discourage the remaining loyalists, affecting the use of other Google products and services. For example, Google+ users are twice as likely as any other online American to be using Google Nexus Player, and Google Chromecast. And, in China and India, Google+ adult users have an above-average share of using Google TV and Google Nexus Player. Furthermore, in India, Google+ users actively use an average of 1.64 Google devices, including Smartphones and Tablets.
If the transition is managed well, Google’s attempt to reverse the polarity of a negative to a positive may avoid inadvertently changing Google+ to Google minus.
About TUPdates
These results are based on results of the MetaFacts TUP/Technology User Profile survey, from TUP 2018, its 36th consecutive wave, as well as previous waves.
TUPdates feature analysis of current or essential technology topics. The research results showcase the TUP/Technology User Profile study, MetaFacts’ survey of a representative sample of online adults profiling the full market’s use of technology products and services. The current wave of TUP is TUP/Technology User Profile 2020, which is TUP’s 38th annual. TUPdates may also include results from previous waves of TUP.
Current subscribers may use the comprehensive TUP datasets to obtain even more results or tailor these results to fit their chosen segments, services, or products. As subscribers choose, they may use the TUP inquiry service, online interactive tools, or analysis previously published by MetaFacts.
On request, interested research professionals can receive complimentary updates through our periodic newsletter. These include MetaFAQs – brief answers to frequently asked questions about technology users – or TUPdates – analysis of current and essential technology industry topics. To subscribe, contact MetaFacts.
Usage guidelines: This document may be freely shared within and outside your organization in its entirety and unaltered. It may not be used in a generative AI system without express written permission and licensing. To share or quote excerpts, please contact MetaFacts.
Dan Ness, Principal Analyst, MetaFacts, May 3, 2018
Millennials have been getting a bad rap lately, with pundits suggesting that they’re squandering their financial futures on avocado toast or cold brew. While our TUP study doesn’t track café treats, we’re finding robust spending on technology devices and services by millennials. Among millennials, homeowners outspend their home-renting counterparts by far.
Based on our most recent wave of TUP/Technology User Profile 2017 US – millennial homeowners are far more likely than millennial renters to be using an Apple Watch or Google Wear smartwatch. Furthermore, they’re well above all other groups in using tech devices they don’t own – such as an employer-provided mobile phone, e-book reader, or tablet. They stand out for having their nest feathered by entertainment devices such as home projectors and OTT TV devices such as an Amazon Fire TV or Google TV. Also, these digital feathernesters are more likely than average to be protecting their homes with smart locks and video doorbells.
Differences in tech usage by home ownership status are not only about age since Generation X homeowners are also well above GenX renters. Interestingly, the mix of devices used by GenX homeowners is like those used by Millennial homeowners, although at lower levels. Millennial homeowners are a substantial market segment, making up nearly one in four connected adults. This group is only slightly larger than the 20% which are GenX homeowners and 22% which are boomer homeowners. Renters are the smallest share of connected adults in every age group. Among millennials, a higher share is renters than the rate in other age groups, although homeowners still outnumber renters by nearly two to one.
Looking ahead
Millennial feathernesters have impressive plans, with their tech purchase intentions higher than any other age or home ownership group. Their plans which are strongly higher than the plans of other age and home ownership groups span nearly all types of devices: notebooks, tablets, and smartphones.
Home ownership status is less of a factor among GenX. Unlike the pattern among current tech users, GenX homeowners don’t have substantially stronger plans than do GenX renters. And among Baby Boomers, the pattern is slightly reversed. For many tech products, especially the most-mobile devices, a higher share of Boomer renters plan to purchase notebooks, tablets, smartphones, and desktop PCs than do Boomer homeowners.
Notes
For decades, MetaFacts has focused on research technology usage and adoption, and segmented users by a wide variety of sociodemographic and behavioral factors. This helps us support our wide variety of clients, some of who use different segmentation and analysis approaches that change over time. While many of our clients employ proprietary segmentation approaches, others seek to analyze the market using more publicly-available or convenient standards.
Analysis by age is one widely-used view, and often a productive starting point for deeper analysis. In some cases, age is a key component of the life stage, reflecting passages such as adulthood or retirement. In other cases, the birth year is used to identify a generational group. Segmentation approaches seek to identify groupings of people who as similar to each other as they are different from members of other groups.
For the analysis in this TUPdate, MetaFacts categorized online adults into the following age groups:
Millennial adult (born 1981-1999, age 18-36)
Generation X (born 1965-1980, age 37-52)
Baby Boomer (born 1946-1964, age 53-71)
Silent+Greatest Generation (born 1945 and before, age 72+)
In our standard TUP analysis, we often split Millennials and GenX into younger and older groups, since much of the technology adoption varies within each of these groups. MetaFacts continues to conduct custom analyses of the groupings that are the most useful concerning their use and adoption of technology, as well as concerning broader sociodemographic and behavioral analysis.
We’re also monitoring the ongoing discussion among the research community around the possible name of the next generation following Millennials. In January 2018, a New York Times reader request turned up suggestions such as “memelords”, “iGeneration”, “deltas”, or “Generation Z or GenZ”. https://www.nytimes.com/2018/01/31/style/generation-z-name.html
About TUPdates
TUPdates feature analysis of current or essential technology topics. The research results showcase the TUP/Technology User Profile study, MetaFacts’ survey of a representative sample of online adults profiling the full market’s use of technology products and services. The current wave of TUP is TUP/Technology User Profile 2020, which is TUP’s 38th annual. TUPdates may also include results from previous waves of TUP.
Current subscribers may use the comprehensive TUP datasets to obtain even more results or tailor these results to fit their chosen segments, services, or products. As subscribers choose, they may use the TUP inquiry service, online interactive tools, or analysis previously published by MetaFacts.
On request, interested research professionals can receive complimentary updates through our periodic newsletter. These include MetaFAQs – brief answers to frequently asked questions about technology users – or TUPdates – analysis of current and essential technology industry topics. To subscribe, contact MetaFacts.
Usage guidelines: This document may be freely shared within and outside your organization in its entirety and unaltered. It may not be used in a generative AI system without express written permission and licensing. To share or quote excerpts, please contact MetaFacts.
Dan Ness, Principal Analyst, MetaFacts, April 13, 2018
Keep stopping the ads!
So say a large and growing group of consumers.
There are multiple ways consumers are expressing this, from actively using ad blockers, to moving beyond “freemium” sites and content to those offering an ad-free experience with a paid subscription, or simply reducing their media consumption.
Ad blockers are being used by a substantial share of online adults in the US. Based on our 2017 wave of TUP/Technology User Profile throughout the US, 40% of Connected Adults are actively using an ad blocking app on at least one of their connected devices.
Usage guidelines: This document may be freely shared within and outside your organization in its entirety and unaltered. It may not be used in a generative AI system without express written permission and licensing. To share or quote excerpts, please contact MetaFacts.
Dan Ness, Principal Analyst, MetaFacts, April 10, 2018
Younger adults are moving away from Facebook, even while they continue to use other social networks.
The highest share of adults actively using social networks, although not using Facebook, are adults age 18 to 24. The highest share is among males age 18 to 24, with 15% doing so. That is closely followed by females age 18-24 with 11% doing so.
These two gender/age segments were also the top two Facebook-avoiding groups a year earlier. As we reported in TUP 2016, 14% of males age 18-24 and 12% of females age 18-24 were active social networkers not using Facebook.
Also, this is part of a continuing and growing trend. In TUP 2015 we reported that 10% of males age 18 to 24 and 10% of females age 18 to 24 were active social networkers not using Facebook.
About TUPdates
These results are based on results of the MetaFacts TUP/Technology User Profile 2017 survey, its 35th consecutive wave, as well as previous waves.
TUPdates feature analysis of current or essential technology topics. The research results showcase the TUP/Technology User Profile study, MetaFacts’ survey of a representative sample of online adults profiling the full market’s use of technology products and services. The current wave of TUP is TUP/Technology User Profile 2020, which is TUP’s 38th annual. TUPdates may also include results from previous waves of TUP.
Current subscribers may use the comprehensive TUP datasets to obtain even more results or tailor these results to fit their chosen segments, services, or products. As subscribers choose, they may use the TUP inquiry service, online interactive tools, or analysis previously published by MetaFacts.
On request, interested research professionals can receive complimentary updates through our periodic newsletter. These include MetaFAQs – brief answers to frequently asked questions about technology users – or TUPdates – analysis of current and essential technology industry topics. To subscribe, contact MetaFacts.
Usage guidelines: This document may be freely shared within and outside your organization in its entirety and unaltered. It may not be used in a generative AI system without express written permission and licensing. To share or quote excerpts, please contact MetaFacts.
Dan Ness, Principal Analyst, MetaFacts, March 28, 2020
Getting things done. Isn’t it one of the main explanations we offer when we’re buying our tech devices?
While much of actual tech device usage is about entertainment, communication, and shopping, productivity has its solid place in everyday use.
Whether using a PC, smartphone, tablet, or some combination, the majority of connected adults turn to their devices for everything from scheduling appointments to calling on a voice assistant. Based on our TUP/Technology User Profile 2017 US survey wave, 88% of connected adults regularly use one of their connected devices for any of a range of productivity activities.
Mobility is the key to productivity activities
Having one’s device handy is key for productivity-oriented people. The majority of productivity activities are regularly done using a mobile device – a notebook, tablet, or mobile phone. This focus on mobility has remained relatively constant over the last few years, representing over two-thirds of the primary productivity devices.
PCs as dominant device type for productivity
Americans use a PC of some kind for most of their productivity activities. This majority position has withered over the last two years, declining slightly from 54% and 55% of adults to the 51% mark in 2017.
During that same time period, more adults have made the switch from basic cell phones to Smartphones. This has helped mobile phones to increase their share as the favored productivity device, rising to second-place with 41% of adults.
Smartphone surpass desktops as a preference for productivity
Diving more deeply into the TUP data, and looking at connected devices in a more detailed view, smartphones emerge as the major productivity device. Even looking at desktops versus smartphones by combining tower desktops with all-in-one desktops, the year 2017 marks the first time that smartphones outnumber desktops as the preferred productivity device. In 2016, TUP showed that 37% of the primary productivity devices are desktops to 34% for smartphones. In 2017, this shifted to 33% desktops and 39% smartphones.
Voice assistants, such as Apple’s Siri, are one of the major productivity activities which have grown in usage, especially on smartphones. For those users who primarily use a smartphone for most of their productivity, 57% use a voice assistant at least monthly, a level which is 44% higher than the national average. They’re also 30% or more higher than average to be using their smartphone to manage tasks/to-do items, their personal or work calendar, store their contacts, and to save and play voice memos.
Notebooks, on the other hand, are making a gradual retreat as the productivity device of choice. These still stand out, however, for being above average for certain activities among those who favor their notebooks for productivity. Several productivity activities which are done on notebooks at 25% or more above average: collaborating on work or personal files, finances/accounting, write/manage text/notes/documents, download/use/update anti-virus/security software, and adblocking software. Yes, the productivity-oriented are more likely than average to block ads and get back to work.
For productivity-primary desktop PCs, however, only two productivity activities stand out above average in their regular use: download/use/update anti-virus/security software, and adblocking software. Although these two activities do reduce interruptions, they aren’t particularly productive. This indicates that desktops are likely to continue their slide from primacy for productivity. They’ll either be consigned to other types of activities or be overtaken by notebooks or tablets.
Looking ahead
Although habits change slowly, they do change. Even as users move between multiple devices, it takes time for them to migrate their behaviors from one way of doing things to another. Apps that have versions that support platforms can ease the user’s migration between devices. By simultaneously supporting multiple platforms, the app makers can also make it easier for users to get things done among their own collection of devices, further supporting the user’s own choices.
About TUPdates
These results are based on results of the MetaFacts TUP/Technology User Profile survey, from 2015 through 2017.
TUPdates feature analysis of current or essential technology topics. The research results showcase the TUP/Technology User Profile study, MetaFacts’ survey of a representative sample of online adults profiling the full market’s use of technology products and services. The current wave of TUP is TUP/Technology User Profile 2020, which is TUP’s 38th annual. TUPdates may also include results from previous waves of TUP.
Current subscribers may use the comprehensive TUP datasets to obtain even more results or tailor these results to fit their chosen segments, services, or products. As subscribers choose, they may use the TUP inquiry service, online interactive tools, or analysis previously published by MetaFacts.
On request, interested research professionals can receive complimentary updates through our periodic newsletter. These include MetaFAQs – brief answers to frequently asked questions about technology users – or TUPdates – analysis of current and essential technology industry topics. To subscribe, contact MetaFacts.
Usage guidelines: This document may be freely shared within and outside your organization in its entirety and unaltered. It may not be used in a generative AI system without express written permission and licensing. To share or quote excerpts, please contact MetaFacts.
Dan Ness, Principal Analyst, MetaFacts, March 23, 2018
The number of connected adults continues to rise in the US. Based on our TUP/Technology User Profile 2017 wave, there are 212.6 million adults who regularly connect to the Internet using a PC, mobile phone, tablet, or game console. This number is up 18.9 million from the 193.8 million adults we reported in our TUP 2013 wave.
While some of the increase has come from a growing adult population, the share of adults actively connected has also grown, due in large part to the increasing use of smartphones. The use of tablets such as Apple’s iPad has also expanded since 2013, although declined somewhat in 2017.
Usage guidelines: This document may be freely shared within and outside your organization in its entirety and unaltered. It may not be used in a generative AI system without express written permission and licensing. To share or quote excerpts, please contact MetaFacts.
Dan Ness, Principal Analyst, MetaFacts, March 19, 2018
When consumers buy a home printer, they’re also buying ink for as long as they use their printer. HP has the lowest rate of US consumers using refilled ink. Of the major brands, HP has the lowest share – 16%, while Brother and Dell have the highest share, 37%. Over the last two years, this refill share has only slightly wavered.
This is based on the most recent wave of TUP/Technology User Profile, the 2017 edition. The majority of HP’s home printer customers are using HP’s ink, and only 7% are using a replacement brand such as Office Depot or Staples.
Usage guidelines: This document may be freely shared within and outside your organization in its entirety and unaltered. It may not be used in a generative AI system without express written permission and licensing. To share or quote excerpts, please contact MetaFacts.